AS YOUR DATA CENTRE GROWS, SO MUST THE DEPTH OF CONTROL.
Vaiking consolidates building systems, IT monitoring, energy metering and DCIM into one system and acts before incidents escalate.
SEPARATE SYSTEMS. NO SHARED OPERATIONAL PICTURE.
01System silos
The cooling unit has been raising an alarm in the building management system for 40 minutes. IT monitoring has no access to that context, no awareness of the rising temperature. Separate systems, separate partial views. No shared context to connect them.
02Context blindness
Temperature in row 7 is climbing. Is it the new batch job load? A failed CRAC fan? An early hardware fault? Without shared context from CPU load, power draw and cooling status, the question has no answer without a common system view.
03Reactive operations
A switch in row 7 has rebooted. A ticket opens. Eight minutes without context, without automated response, without cross-referencing the cooling status. That happens when systems are not evaluated together.
04Reporting overhead
The EnEfG deadline is approaching. Your energy data sits in three systems with no shared time base. One colleague pulls the exports, another reconciles the meter readings. Significant manual effort for figures that could be produced automatically from the running operation.
ONE SYSTEM. FROM COOLING UNIT TO DCIM SYNCHRONISATION.
Vaiking aggregates your existing systems, evaluates states in context and executes defined interventions, with automatic verification of the outcome.
Consolidated view
Vaiking connects IP-capable devices directly and reaches building management systems via gateways for protocols such as KNX, Modbus and BACnet. Existing systems remain authoritative within their domain. Vaiking aggregates and correlates data across system boundaries.
>65,000 metrics simultaneously in our own research data centre. Reference value from live operations, not a generic performance claim for every deployment.
Context-based state assessment²
Thresholds adapt to operational conditions. The system derives typical operating patterns from historical data and evaluates deviations in context: CPU load, temperature and power draw are interpreted together, not in isolation.
Rule-based automation with pre-/post-condition checks¹
Every action follows three phases. If the target state is not reached, a defined compensating measure takes effect or the action is escalated. No silent failure.
- PRE: Check of preconditions (redundancy available, no active maintenance window)
- EXEC: Execution of the defined action
- POST: Verification that the target state was reached
Every automated action documents the initial state, the intervention and the outcome.
DCIM synchronisation module
Vaiking does not replace DCIM. It complements it: bidirectional sync with systems such as NetBox and FNT Command. DCIM documents and plans. Vaiking monitors and controls. Together they provide a complete operational picture.
¹ Pre-/post-condition checks: protected by utility model.
² Dynamic AI thresholds: protected by utility model.
WHAT VAIKING DOES IN LIVE DATA CENTRE OPERATIONS.
Thermal anomaly with automated VM migration
At 4:09 a.m., temperature in row 7 exceeds the typical curve for the current load. Vaiking correlates the rise with CPU load, power draw and cooling status of the zone, and evaluates whether a migration is necessary before a human sees the ticket.
No SLA breach. Full audit trail with timestamp, initial state and outcome. Without Vaiking: manual intervention after escalation, with unknown response time.
Network component unreachable
A switch in row 3 stops responding. No maintenance window is active. Redundant uplinks are available but tracked in separate systems with no shared state.
Switch reachable, services stable. Full audit trail. Without Vaiking: manual PDU reset after escalation, response time unknown.
EnEfG reporting without manual data collection
The EnEfG deadline is six weeks away. Your energy data is already being generated, second by second, as a by-product of ongoing operations. Vaiking consolidates it with a shared time base, broken down by IT load and infrastructure consumption. No separate data collection, no project assignment to the team.
Reproducible audit trail, exportable via REST API. Days or even weeks compared to manual consolidation from systems without a shared time base.
Tenant isolation in multi-customer setups
Multiple customers on shared infrastructure: Vaiking cleanly separates data and states per tenant. Each customer sees only their own racks, their own consumption, their own environment values.
Granular permission model: separate view and control rights at user and group level.
WHAT EACH MODULE SOLVES IN YOUR OPERATION.
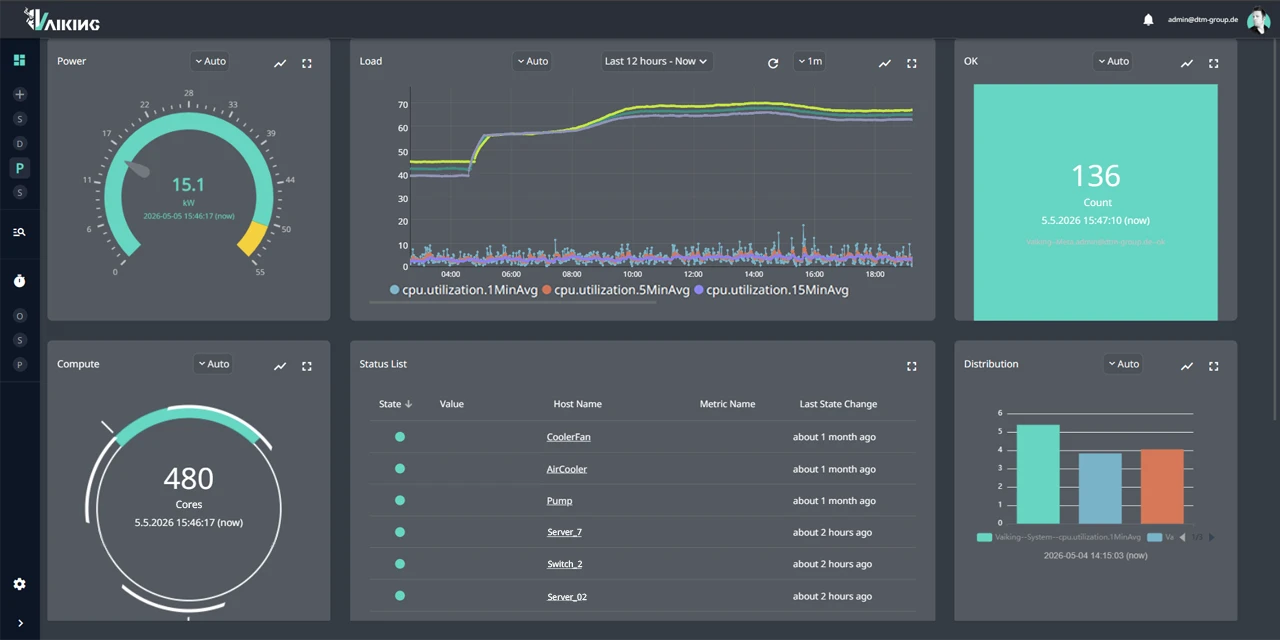
Monitoring
- Servers, cooling units and energy meters on a shared timeline
- PUE and rack power consumption in real time without manual aggregation
- Thermal correlations between IT and building systems made visible
Automatisierungs-Modul
- VM migration on thermal anomaly without manual intervention
- Cooling regulation during load shifts with PRE/POST validation
KI-Modul
- Filter out backup job spikes and maintenance cycles as known patterns
- Detect efficiency deviations before thresholds are breached
30 MINUTEN. THEN YOU'LL KNOW WHETHER VAIKING FITS YOUR DATA CENTRE.
No generic demo. We look at your specific setup: which systems you run, where the gaps are, what an integration would look like.