CRITICAL CONDITIONS OFTEN ONLY BECOME VISIBLE AFTER CONSEQUENCES HAVE ALREADY OCCURRED.
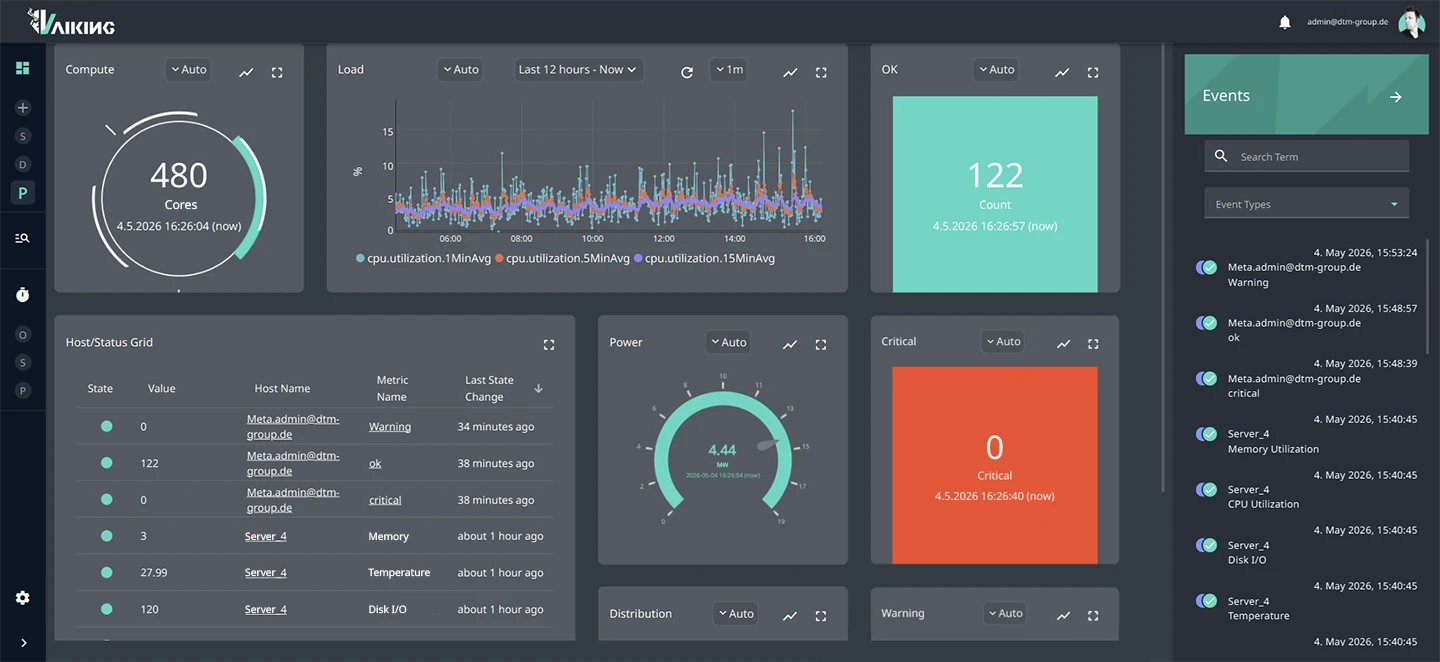
Vaiking correlates IT, building, energy and security data so incidents become visible earlier and in the right context.
Monitoring is the foundation for the Automation Module and the AI Module.
OUTAGES ORIGINATE BETWEEN SYSTEMS. NOT WITHIN THEM.
The power meter drops. Three servers show elevated CPU temperature. IT monitoring sees servers. Building systems see the HVAC unit. No system sees both at the same time.
By the time the cause is identified, measures have already been taken: against the wrong problem. Restarts, tickets, escalations. The actual fault remains undetected.
FEWER OUTAGES. FASTER RESPONSE. ON-CALL RELIEVED.
No wrong restarts
The root cause is correctly identified because IT and building systems share the same data stream. Whoever knows the right trigger does not act on the wrong problem.
Escalation only after confirmed anomaly
Brief spikes and known load peaks generate no alert. An escalation occurs when it is operationally relevant. Not during the nightly backup job.
Root cause analysis in minutes
Because all metrics can be correlated without switching between multiple systems. IT, OT, energy and security share the same data stream.
ALL DOMAINS. NO INTERVENTION IN YOUR EXISTING SYSTEMS.
Vaiking is deployed in parallel. Existing systems remain unchanged. Covered areas:
IT Infrastructure
Servers, networks, cloud services, virtual machines and web APIs. Protocols: SNMP, SSH, REST API, Ping, Syslog, etc.
OT & Building Systems
HVAC units, UPS, PDUs, PLCs, energy meters and building management systems. Protocols: Modbus, BACnet, KNX, Siemens S7, etc.
Security & Access
Access control systems and security cameras in the same interface as IT infrastructure.
Energy & Compliance
PUE calculation, IT load share and ESG metrics directly from operational monitoring. Energy efficiency and CSRD reports are generated automatically.
DCIM Integration
Bidirectional synchronisation with systems such as NetBox or FNT Command. Documented inventory and live status remain in sync: no replacement, no redundancy. Newly created devices receive the appropriate checks via automatically assigned tags, without manual follow-up in Vaiking.
Passive Checks & External Agents
Not all systems can be queried actively. Vaiking therefore also supports data push: Sources such as SNMP Traps, Syslog and REST API deliver events directly into the system. Agents on other systems send data independently, without Vaiking polling.
THE ALERT GETS THROUGH. ON THE CHANNEL THAT COUNTS.
All channels, configurable per alert
Vaiking forwards confirmed alerts via email, push, SMS and Teams. Ticket systems such as ServiceNow and Jira are connected directly. The channel used is configurable per alert.
Relevant alerts only, at the right time
Notifications are configured per host, per metric or per event type. Time windows can be restricted, for example to business hours. Global deactivation is possible without losing configuration.
Maintenance windows and alert acknowledgement
Downtime windows define the periods during which notifications for specific hosts or segments are suppressed. Active alerts can be acknowledged to make the acknowledgement status visible to all parties.
FITS INTO EXISTING STRUCTURES.
Users managed centrally
Vaiking integrates existing LDAP directories. Roles define who can see which areas and who is authorised to act. No separate user management alongside existing infrastructure.
Each organisational unit sees only its own data
Multiple customers or internal units operate in the same instance without access to each other's data. Separation is configurable; no separate deployment per tenant required.
REST API: primary or integrated system
Vaiking provides a REST API through which external systems can retrieve status data. At the same time, Vaiking can write data into other systems. Whether Vaiking is the primary system or embedded: the interface is bidirectional.
WHAT HAPPENS WHEN SOMETHING GOES WRONG?
When an auditor asks, you can answer
Every state is logged: metric, timestamp, threshold, triggered response. Traceable without manual documentation. The log is complete and permanently accessible.
Customer data does not leave the defined boundary
Cloud processing exclusively in German dtm data centres. On-premise deployment available. No data transfer to third parties. GDPR-compliant by design.
Long-term vendor
dtm-group is a family-owned company founded in 1968, now in its second generation. 80 employees, 8 locations.
Proven in live operations
Vaiking has been running since 2019 in the 4.4 MW research data centre of dtm-group in Sweden, under real load conditions, not in a sandbox. What works there every day is the product that customers use.
WHEN THE HVAC UNIT IS THE ACTUAL PROBLEM
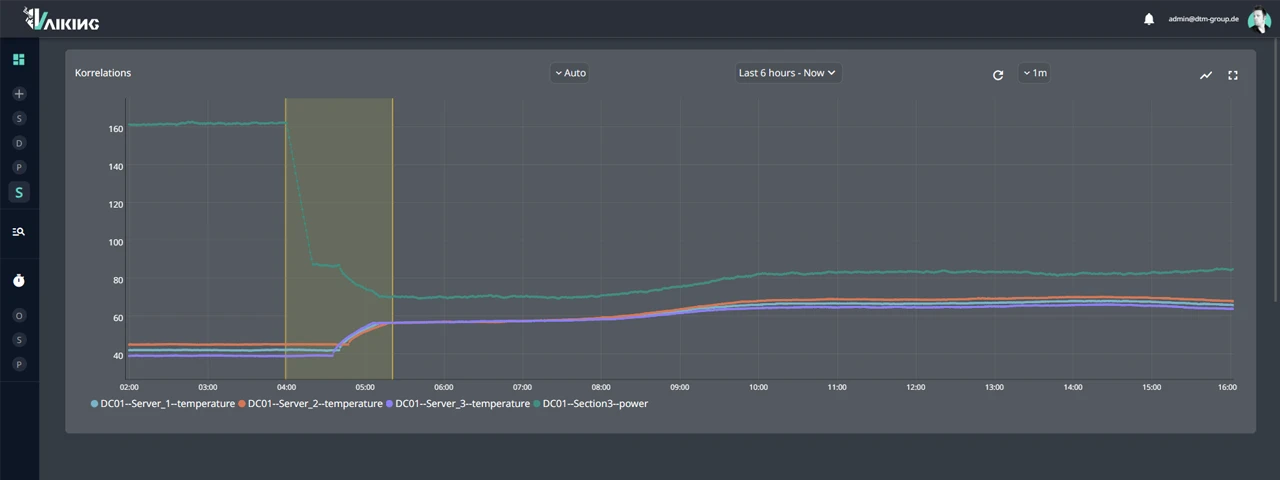
Server row B, 02:40. CPU temperature on three servers rises simultaneously with no apparent cause. Server monitoring reports elevated temperature, suggests a restart.
Vaiking sees more: at the same time as the CPU anomaly, the power meter in building section 3 shows a drop. The HVAC unit serving that area has been running at reduced capacity for 40 minutes.
Not a server problem. A cooling problem that disguised itself as a server problem.
Without the correlation between IT and building systems, a restart would have been initiated. The cooling problem would have remained. The next escalation: inevitable.
THE ARCHITECTURE BEHIND THE DATA STREAM
The mechanisms that explain why 65,000+ metrics remain evaluable in real time. Without compromising speed or archive depth.¹
Hybrid database
Vaiking combines an in-memory database for real-time processing with a time-series database for long-term archiving. State changes are visible immediately, not after the next polling cycle. Historical trend analysis runs from the same source: no separate reporting system, no synchronisation loss.
Result Processor
Every incoming metric is checked against static and dynamic thresholds. Aggregated values and AI results also feed in as input. All incoming data streams pass through the same configured evaluation process.
Recheck logic with hysteresis
Before an alert is triggered, Vaiking checks the state again. Brief spikes generate no alert. The system distinguishes between genuine state changes and transient noise: no flapping, no alert noise. On-call is only contacted when the problem is real.
Tags & saved searches
Hosts and metrics are classified with static, group-based or automatically assigned tags. The system assigns tags independently, for example when a metric reaches a defined state. Frequently used filters can be saved as searches and called up directly.
Credentials for checks: centralised and encrypted
Active checks require access to target systems: SSH keys, SNMP community strings, API tokens, etc. These are stored centrally in the system in encrypted form and retrieved at runtime. No plaintext in check configurations.
¹ Reference value from own operations. Not a generic performance claim.
PARALLEL TO EXISTING TOOLS. READ-ONLY. WITHOUT A CUTOVER DATE.
Parallel operation without a cutover date
Vaiking runs alongside existing monitoring solutions. No shutdown, no migration. You decide when and whether Vaiking becomes the primary system.
Read-only, without system intervention
Monitoring reads operational data, correlates it and raises alerts. It does not change system states and does not intervene in running processes. Interventions are exclusively configurable via the Automation Module.
Existing tools remain primary
NetBox, FNT Command, ticketing systems, ITSM platforms: Vaiking integrates bidirectionally. No replacement, no double maintenance. Existing processes continue. Vaiking adds the data stream.
Exit without data loss
Adoption and exit are possible without data loss or system changes. Vaiking does not replace existing systems. Your infrastructure and processes remain primary at all times.
YOU KNOW WHAT VAIKING MONITORS. NOW WE ASSESS WHETHER IT COVERS YOUR SETUP.
We check whether Vaiking genuinely consolidates your silos.