Monitoring and automation for IT, OT, and building systems.
Critical conditions emerge between isolated system contexts and often become visible too late. Vaiking monitors, intervenes, validates. No lock-in to proprietary protocols.
NO NEW HARDWARE. NO VENDOR LOCK-IN. NO BIG-BANG MIGRATION.
Integrated via: REST-API · SNMP · Modbus · BACnet · KNX · CommScope iPatch
30 minutes. Then you'll know whether Vaiking fits your setup.
NO COMMON SITUATIONAL PICTURE. NO VALIDATED RESPONSE.
Multiple systems. No shared context.
IT, network, and servers have monitoring. BMS, building controls, and energy systems often do too. But the systems do not communicate operationally. No shared context, no cross-domain response logic.
The invisible failure
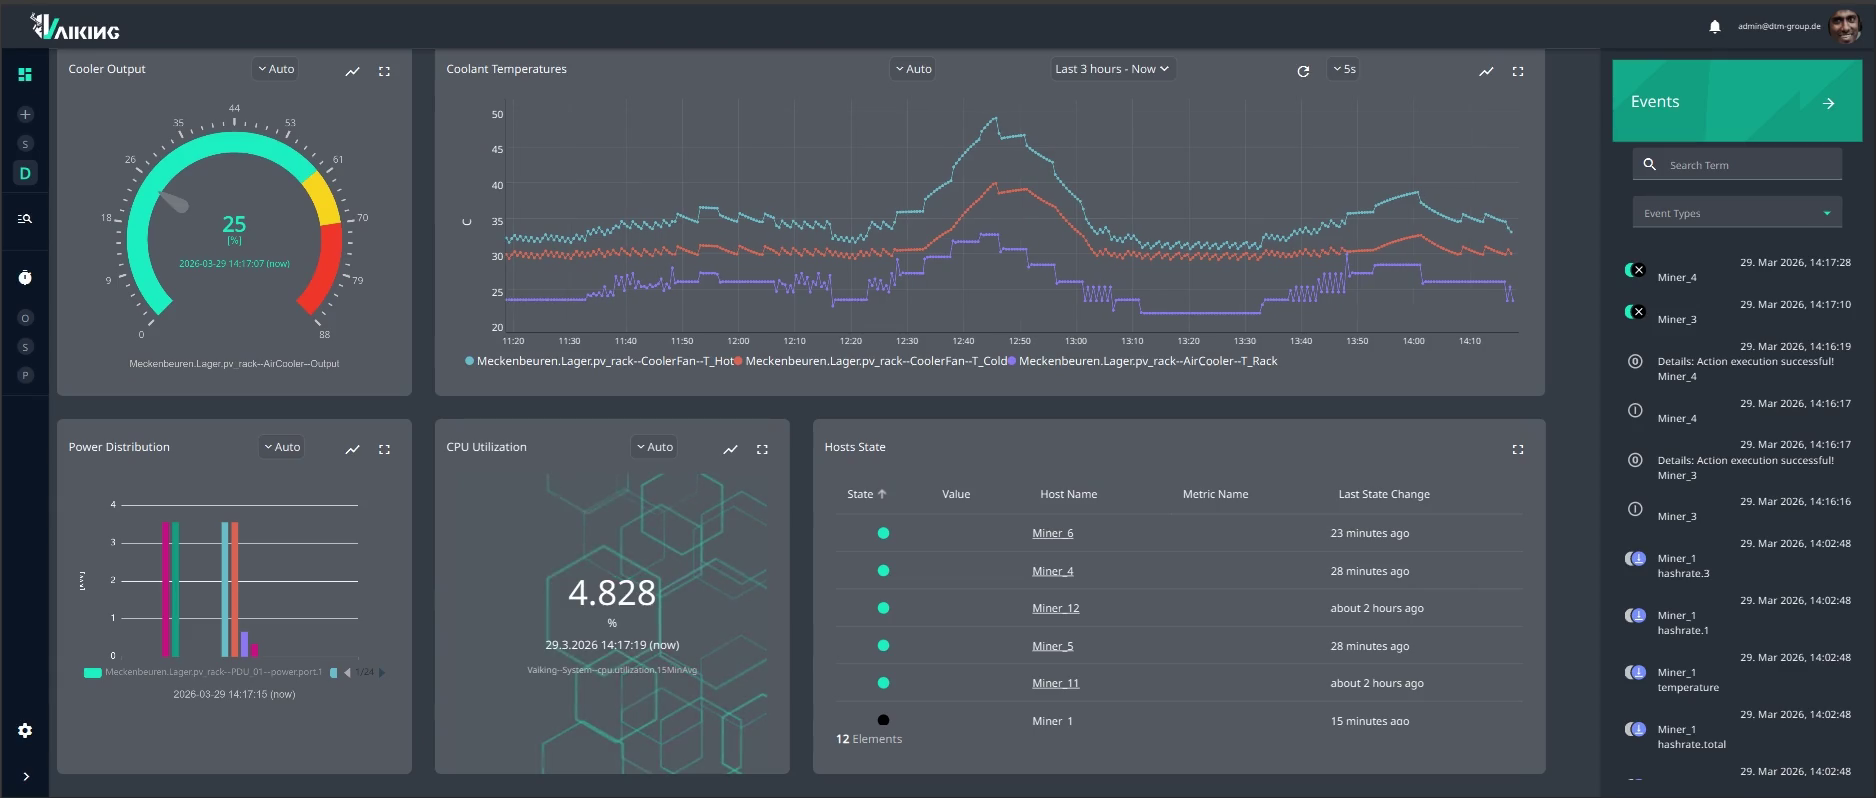
The cooling unit in server row C sends a warning. Your IT monitoring shows green. No system makes the connection. No automatic response triggers.
You hear about it from the facilities team. Not from your dashboard.
Vaiking doesn't just assess conditions, it can trigger defined responses before a problem escalates.
ONE SYSTEM THAT INTERVENES. NOT JUST REPORTS.
Vaiking connects conditions that remain isolated in classic single-domain systems. Learns what is normal in your operation. And intervenes before it escalates.
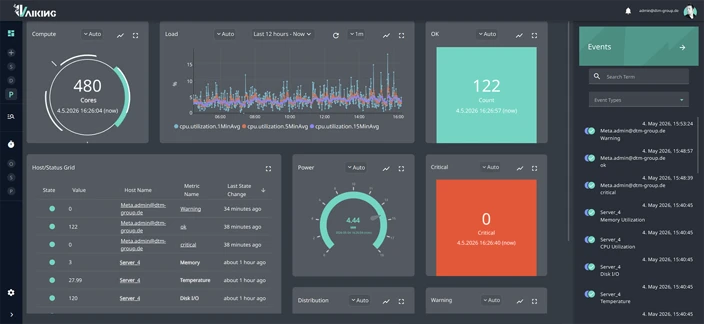
REAL-TIME OVERVIEW. ALL DOMAINS.
Autodiscovery finds new devices; open protocols connect existing ones.
Your setup grows, Vaiking grows with it: 65,000+ metrics simultaneously¹, horizontally scalable and designed for larger infrastructures.
Each customer sees only their data.
EnEfG/CSRD reporting runs automatically alongside.
¹ Reference value from own operation. Not a generic performance claim.
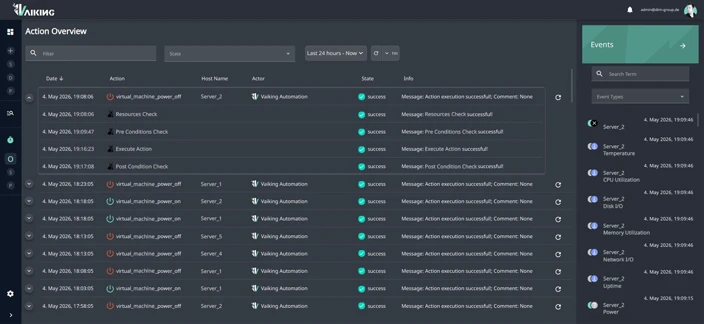
AUTOMATICALLY INTERVENE. VERIFIED EXECUTION.
You define the rules. Vaiking executes them. No alert someone has to react to. A verified action.
Before each intervention, Vaiking checks preconditions. After each intervention, it confirms the result. If an action fails, Vaiking compensates automatically.¹
PRE ✓ → Exec ✓ → POST ✓
¹ Pre-/post-condition checks: protected by utility model.
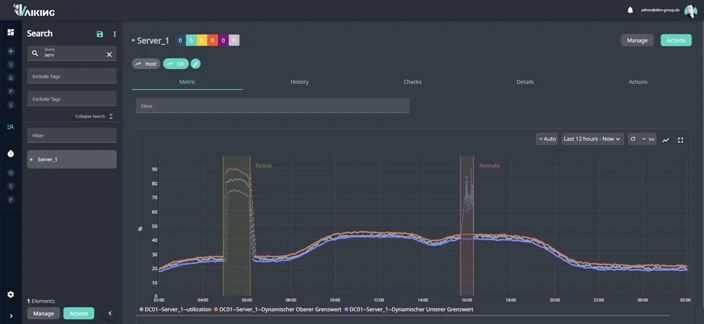
LEARNS. DETECTS. OPTIMISES.
Vaiking learns typical operating conditions and sets thresholds dynamically based on historical data. No manual calibration.²
Vaiking detects deviations in real time. Combined with the Automation Module, actions are triggered directly without waiting for manual intervention.
In our own research data centre, PUE values around 1.02 were achieved under site-specific conditions.
² Dynamic AI thresholds: protected by utility model.
30 minutes. Then you'll know whether Vaiking fits your setup.
WHICH SECTOR ARE YOU IN?
Each sector has its own requirements.
DATA CENTRE
Servers, cooling, and power in one dashboard. New devices are discovered automatically.
For data centres →COLOCATION
Each tenant sees only their data. Energy metering and billing per customer.
For colocation →NETWORK INFRASTRUCTURE
Active and passive components in one system. Fault localisation in minutes, incl. CommScope iPatch.
For networks →INDUSTRY
PLC, fieldbus, and IT in one system. Detect failures before they cost production time.
For industry →BUILDINGS & FACILITIES
Heating, cooling, and PV in one dashboard. Energy consumption becomes transparent and controllable.
For buildings →SOLUTION PROVIDER
White-label and multi-tenant. New managed services live faster in production.
For solution providers →REAL NUMBERS. LIVE OPERATION.

Nordic Research Data Center, Boden / Sweden
OUR OWN RESEARCH DATA CENTRE. IN OPERATION SINCE 2019.
4.4 MW installed capacity. >2,500 monitored hosts. >65,000 metrics simultaneously, multi-tenant, in real time. Mixed workloads: HPC, cloud, infrastructure testing.
~3 on-site visits per year. Everything else runs autonomously.
This is our own data centre. Developed over six years in real operation before we offered it as a product.
¹ Achieved through operational optimisation with AI Module in combination with subarctic climate, water cooling, and renewable energy at the site. Industry average Germany: ~1.5.
Power2Bytes, Meckenbeuren
FULLY AUTONOMOUS OPERATION. POWER, COOLING, AND COMPUTE IN ONE SYSTEM.
167.5 kWp PV system · 48 kWh storage · EV charging · cooling · heating
~94 MWh produced · ~72 MWh consumed
One system controls everything. No demo setup, no lab test. Live operation since commissioning.
dtm-group · FAMILY BUSINESS SINCE 1968 · 80 EMPLOYEES · GDPR-COMPLIANT · DATA CENTRES EXCLUSIVELY IN GERMANY
WHAT SETS US APART.
Vaiking was built for IT, OT, and building systems from the ground up. One system with verified interventions.
Simplified classification of typical product categories. Individual products may vary depending on configuration.
| Feature | Vaiking | Classic IT Monitoring | DCIM / Documentation |
|---|---|---|---|
| Scope | IT + OT + buildings + energy | IT infrastructure | Documentation |
| Automatic interventions | Pre-/post-checks per action ¹ | Alerting, manual | — |
| Dynamic thresholds (artificial intelligence) | Dynamic, learning ² | Static thresholds | — |
| EnEfG/CSRD reporting | Automated, integrated | — | — |
| Multi-tenancy | Each tenant sees only their own data | Limited | Limited |
| DCIM integration | NetBox, FNT via sync | — | Core functionality |
| Data storage | In-memory + time series ³ | Time series + real-time alerts | — |
| CommScope iPatch | AIM integration proven | — | — |
| REST API | Fully documented | Partial | Proprietary, limited |
¹ Pre-/post-condition checks on automatic actions: protected by utility model.
² Dynamic thresholds (AI Module): protected by utility model.
³ Hybrid storage architecture: in-memory database (real-time processing) combined with time-series database (historical analysis). Protected by utility model.
Where Vaiking is typically used
Vaiking is primarily used in environments where multiple systems need to be viewed together, such as IT, building controls, energy, or industrial plant.
This is where the greatest value is created, because relationships become visible and interventions do not occur in isolation.
Where Vaiking can also be used
Vaiking can also be deployed in homogeneous environments.
In these cases the focus is less on cross-system integration, and more on, for example:
- central view of all conditions
- traceable alerting
- prepared or automated responses
- one unified system instead of multiple point solutions
Assessment
Whether Vaiking makes sense depends not only on the system landscape, but on how strongly processes should be standardised, traceable, and optionally automated.
9 REGISTERED TECHNICAL UTILITY MODELS. FILED WITH THE GERMAN PATENT AND TRADE MARK OFFICE.
MONITORING. €2,990/YEAR. RELEVANT CONDITIONS CENTRALLY VISIBLE.
Monitoring as the starting point. Automation Module and AI Module available as optional add-ons.
~63 hosts · 1,000 metrics
Define rules. Vaiking intervenes.
Learns normal state. Detects deviations.
From ~€249/month at typical metric count for ~63 hosts. Entry point into cross-system visibility across your infrastructure.
4 packages from ~63 to ~500 hosts. Scales with your infrastructure.
30 minutes. Then you'll know what Vaiking costs in your setup.
WE GUIDE EVERY STEP.
No big-bang migration. No migration risk. Your existing monitoring stays. Vaiking is added for the areas your existing monitoring does not cover. Four steps, your pace.
INVENTORY
Autodiscovery and manual additions capture your setup. No production access needed. Afterwards, you and we know what is there and how long the rest takes.
MONITORING
Set up in parallel, without touching your existing monitoring.
Only new domains: cooling, energy, building sensor systems. Two dashboards briefly? Yes. But you immediately see what was invisible before.
CONSOLIDATE(optional)
Your pace. Your decision.
Integrate or gradually replace existing monitoring. All domains in one system when you are ready.
AUTOMATE(optional)
Activate automation rules once monitoring is stable. Pre-/post-condition checks protect every intervention. No risk to live operation.
Why dtm-group?
Family business since 1968. Second generation. We only sell what you need.
Own research data centre in Sweden. 6 years of operational experience under real conditions before Vaiking was offered as a product.
GDPR-compliant: cloud processing exclusively in dtm-group data centres in Germany.
80 employees. 8 locations. Available, including long-term.
Basic support included. SLA and professional services according to operational requirements.
IN 30 MINUTES YOU'LL SEE WHETHER VAIKING
FITS YOUR INFRASTRUCTURE.
Setup check: monitoring and the right modules for your infrastructure.
You get answers. And material you can share internally.