ACTIVE COMPONENTS AND PASSIVE INFRASTRUCTURE IN ONE SHARED OPERATIONAL PICTURE.
Vaiking links interface states with physical patch connections in one data model. From service to patch panel fully traceable end to end, without manual documentation as an intermediate step.
ACTIVE AND PASSIVE MANAGED SEPARATELY. FAULT ANALYSIS TAKES HOURS INSTEAD OF MINUTES.
01Patch outside the maintenance window
The change freeze has been lifted. One of your technicians plugged a patch outside the maintenance window, undocumented. Your AIM system only shows the physical panel-to-panel connection. Which panel is attached to which interface is not visible. The fault investigation drags on. So does the outage.
02PoE budget exhausted: which device fails next?
An IP device goes offline. No alarm, no error message. Your switch exceeded the PoE budget and shut down a device based on an internal priority ranking. Your monitoring shows: device unreachable. Why: no system has the answer. Cause and affected switch only become clear after 20 minutes.
03Unplanned patches stay invisible
Classic AIM systems see panel to panel. Whether an interface with active load is behind the panel, whether the connection was planned or not, whether someone has re-patched: none of that is visible. Every deviation generates the same noise level. You only detect real interventions once the damage is done.
04Growing complexity across multiple sites
More ports, more devices, more sites, more tenants. Classic monitoring approaches scale for data volume but not for interpretation. The volume of data increases. The ability to contextualise it does not.
FROM INTERFACE TO PATCH PANEL. ONE DATA MODEL, NO MEDIA BREAKS.
Vaiking links physical ports, patch connections and active interfaces automatically. Faults can be traced end to end, gap-free, from the logical service to the physical connection, without manual documentation.
Merging logical and physical views
Active components are discovered automatically via SNMP, LLDP, CDP and REST APIs. Sensor-based patch panels such as CommScope iPatch with imVision controllers capture physical connections via optical sensing per ISO/IEC 18598. No RFID, no special patch cables. PoE consumption per port is recorded and documented (AMD1:2021, categories RP1/RP2/RP3). Where no intelligent components are present, imported and manually maintained data is included.
Distinguishing expected from unexpected state²
Historical trend data establishes the normal state for every port, every connection, every device. Deviations are not evaluated in isolation; they are assessed in the context of typical operating patterns. This reduces false alarms and makes gradual changes visible before they become outages.
Rule-based responses with pre-/post-validation¹
When deviations are detected, responses follow a fixed pattern. On failure: a defined countermeasure or controlled escalation. No silent failure.
- PRE: Conditions and dependencies are validated
- EXEC: Defined action is executed (e.g. load shift to alternative uplinks)
- POST: Outcome is verified: did the load stabilise as expected?
Bidirectional integration with systems such as NetBox and FNT Command
Vaiking synchronises connection and asset data bidirectionally with systems such as NetBox and FNT Command. Which system is authoritative for which data is configurable. Conflicts are resolved by defined rules, not manual intervention.
¹ Pre-/post-condition checks: protected by utility model.
² Dynamic AI thresholds: protected by utility model.
WHAT VAIKING CHANGES IN NETWORK INFRASTRUCTURE.
Service fault: switch fine, patch panel wrong
A service is unreachable. Server online, switch interface shows link-up, no error in the network. The cause runs deeper. Vaiking traces the connection from the logical service to the physical path.
Cause identified in minutes rather than hours. No manual search through documentation. The trace from service to physical path is reproducible and auditable.
Referenzprojekt: APT Alu Products: AIM + DCIM + Monitoring, CommScope iPatch, NetBox
Silent outage due to an exceeded PoE budget
An IP device stops responding. No alarm, no error in monitoring. The switch exceeded its budget and shut down a device. Vaiking detects the approach to the limit before the switch decides which device to cut next.
No silent outage. No forensics from a manually maintained spreadsheet.
Planned cabling change: LED-guided execution and automatic documentation
The work order is in the system. The LED on the patch panel lights at the correct port. No paper, no wrong socket. After patching, the system detects the new connection automatically, creates a patch proposal and sends it for approval. If the technician patches a port not in the work order, the system flags the deviation immediately and creates an entry in the change log.
Every connection change is documented, planned or not. Change evidence in real time, without manual after-the-fact recording.
Multi-tenant environment with separated access
Different organisational units or customers access their respective network segments. A granular permission model separates view rights and control rights at user and group level.
Admins see everything. Tenants see only what is assigned to them. No shared data space, no data leak.
WHAT EACH MODULE SOLVES IN YOUR OPERATION.
Monitoring
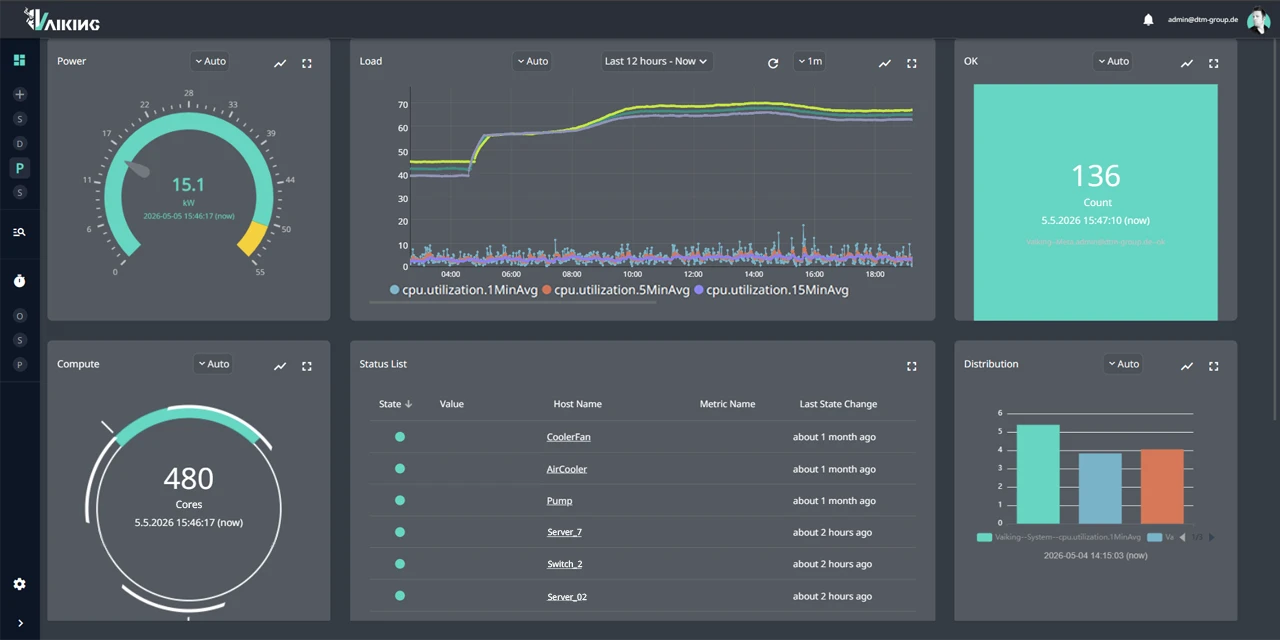
- Logical and physical network view combined on one timeline
- Spontaneous patches and port occupancy visible and traceable as events
- PoE budgets and port states across all sites
Automatisierungs-Modul
- Load shift on port failure with PRE/POST validation
- PoE threshold exceeded with approval logic, no manual response
KI-Modul
- Detect silent outages and PoE budget anomalies before escalation
- Distinguish normal load behaviour per port from an actual fault
30 MINUTEN. WE ASSESS HOW VAIKING FITS YOUR NETWORK ENVIRONMENT.
Active and passive infrastructure, existing tools such as NetBox or FNT Command, CommScope iPatch in legacy cabling: we show what can be integrated immediately.