YOUR EQUIPMENT GENERATES DATA. YOUR OPERATION SHOULD TURN IT INTO DECISIONS.
Vaiking consolidates protocols such as Modbus, OPC UA and Profinet into a unified data model and can intervene within defined limits before an equipment standstill occurs: heterogeneous protocols, one data model, defined intervention boundaries.

THE EQUIPMENT RUNS. NOBODY SEES THE OVERALL STATE.
01IT and OT do not talk to each other
Line 3 is down. The Modbus device is not responding. Is it hardware, network or the controller? IT and OT run separate ticketing systems. Until both teams have the same context, root cause analysis takes longer. So does the downtime. Modbus, OPC UA, Profinet: three protocols, three data silos, no shared operational picture for diagnosis.
02Creeping losses eat into the margin
Static thresholds trigger when it is already too late. Gradual efficiency losses over weeks stay below them. A machine draws progressively more energy at the same load. No alarm, no ticket, no action. The loss accumulates until it appears in the monthly bill or the line goes down.
03Maintenance after failure, not after condition
Calendar-based maintenance means: services too early, failures anyway. Condition-based maintenance requires knowing the condition: not just operational status, but the deviation pattern over time. Without a historical baseline per machine, condition assessments remain expert knowledge.
04Energy prices as an uncontrolled variable
Energy costs rise. Production schedules remain static. The ability to adapt load profiles to price developments exists technically. In practice, centralised data and defined intervention logic are missing. ESG reporting adds pressure: CSRD requires traceable, auditable derivation of energy data.
HETEROGENEOUS EQUIPMENT. ONE DATA MODEL. ASSESSMENT AND RESPONSE IN REAL TIME.
Vaiking integrates existing controllers incrementally via OPC UA as a semantic integration layer. No controller replacement. Vaiking monitors, analyses and intervenes only within defined limits.
Integration into existing equipment without controller replacement
Vaiking connects existing equipment via industrial gateways: protocols such as Modbus, Profibus, Profinet, EtherCAT and OPC UA. OPC UA serves as a semantic integration layer for heterogeneous system landscapes. Integration is incremental. Existing controllers remain authoritative within their domain.
Detecting gradual deviations²
Instead of static thresholds, the system derives typical operating patterns from historical data. Deviations are assessed in operational context: comparison of line and equipment performance, detection of gradual efficiency decline, energy consumption at component level.
Gradual efficiency decline detected. Maintenance before failure, not after.
Automated load adjustment with external data sources¹
Vaiking incorporates energy prices, PV generation and weather data as external inputs. The system adjusts load profiles automatically. If the target state is not reached, a compensating measure takes effect or the action is escalated. No silent failure.
- PRE: Check whether the adjustment is feasible within the production schedule
- EXEC: Adjustment of load profiles
- POST: Monitoring whether the intended load reduction occurs
Condition-based maintenance with ERP/maintenance system integration
Deviations from typical operating patterns are detected, assessed and transferred into existing processes. Direct intervention in controllers only within defined and approved rules.
- Check whether the deviation is stable or transient
- Automatic creation of a maintenance request in the ERP or maintenance system
- Validation of whether the condition normalises after the measure
¹ Pre-/post-condition checks: protected by utility model.
² Dynamic AI thresholds: protected by utility model.
WHAT VAIKING CHANGES IN INDUSTRIAL ENVIRONMENTS.
Line standstill: diagnose across protocol boundaries
6 a.m. The shift supervisor reports: line 3 is down. The Modbus device is not responding. IT sees no network issue. OT has no open ticket. Vaiking aggregates the state of all involved layers in the same data model.
No mutual deflection between IT and OT. The cause is isolated before the second hour of downtime begins.
Detect a gradual deviation before failure
A machine draws progressively more current at constant load over six weeks. No static threshold is violated. No alarm, no ticket. The deviation is only visible by comparing the historical trend.
Vaiking detects the deviation from the baseline and triggers a prioritised notification before the machine fails. Maintenance is planned, not reactive.
Condition-based maintenance with maintenance system integration
A machine shows increasing run times at constant setpoint. The deviation stays below the failure threshold but accumulates over days. Vaiking assesses the pattern as stable and automatically triggers a maintenance request in the ERP or CMMS.
After maintenance, the system checks whether the condition has normalised. No manual feedback process. Full audit trail for traceability.
ESG reporting without manual consolidation
Energy data is generated directly from the running operation of connected equipment. The origin and derivation of metrics are traceable. CSRD-relevant reports come from the same data layer as operational monitoring.
No separate data collection process. Export via fully documented REST API.
WHAT EACH MODULE SOLVES IN YOUR OPERATION.
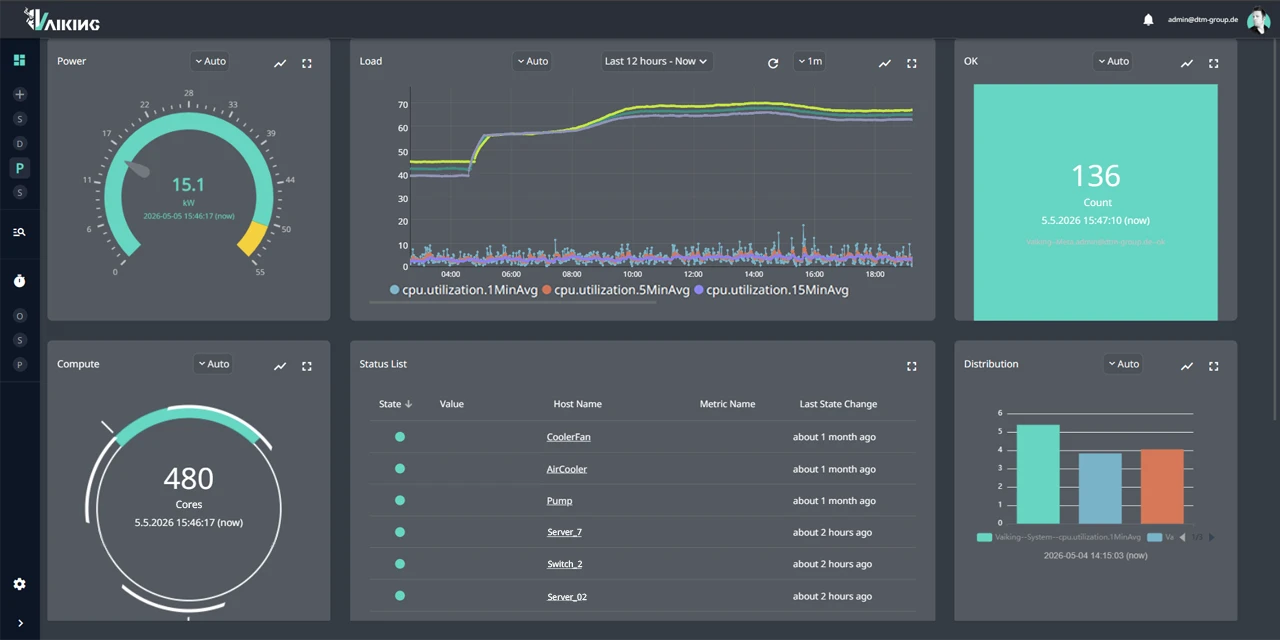
Monitoring
- PLCs, energy meters and SCADA data on a shared timeline
- Gradual losses in production lines visible without controller replacement
- IT and OT correlated without separate systems
Automatisierungs-Modul
- Adjust production load automatically on energy price spikes
- Protective shutdown with defined preconditions, no controller intervention
KI-Modul
- Detect machine wear before failure occurs
- Derive efficiency decline from historical time series data
30 MINUTEN. WE ASSESS WHAT CAN BE INTEGRATED IMMEDIATELY IN YOUR PRODUCTION ENVIRONMENT.
Modbus, OPC UA, Profinet and adjacent infrastructure: we analyse your specific setup and show how Vaiking is integrated incrementally.